High School Sports present a volatile environment for rating and ranking accuracy. Making game predictions based on math rather than the human element is risky at best. HEY… Who scheduled the junior prom on our game night? Our best player is out for three games with a sprained ankle… Sally overslept! (for a 4:30 PM game…). You get the picture. Our ranking system can not capture or interpret these situations. It can only rely on past results to predict future events.
Our rating system is typically based on a maximum score of 25 for the boys with 150+ teams. We had to go to 30 for the girls with well over 300 teams and larger disparity in talent levels. The best team in the state will have the 30 rating. All other teams will have a rating in relation to that team. So if you take the difference between ratings, it will represent the score differential in each set played. Thus if a team with 22 rating is playing a team with 16 rating, we would expect an average game score of 25-19 (or 6 differential). With the girls, if a 30 rated team plays a 2 rated team, it’s an impossible result on a set to 25 but you get the picture that it won’t be a very close match-up.
What is the rating formula? Well… that’s our secret. But the key ingredient in the rating formula is schedule strength of opponents. Along with set score differential and various other factors that go into our algorithm. NJP picked NJ high school hockey games for 8 seasons at a win percentage of 85.6%. Our first year of boys HS volleyball picked winners at 87.7% (640-90). We hope to have similar results for NJ HS Girls Volleyball. With the size of the nightly schedule, we do not expect to select every game like we did with the boys. We may just select a day or two a week to engage “The Predictor”.
Please remember that the rating formula is produced by math. And it takes into consideration the entire body of work for the year. The algorithm does give extra weight to state playoff game wins. Math plays no favorites. And late season ratings are usually much more accurate than early season ratings with a larger pool of data.
We gathered factual scores from multiple public sources to generate our “game table” along with “estimating” some scores that were not publicly available. For missing scores, we used the available rating system factors as estimates. 97% of scores were actual and roughly 3% were estimated so we do not expect a significant statistical error rate or material difference in the rating factor.
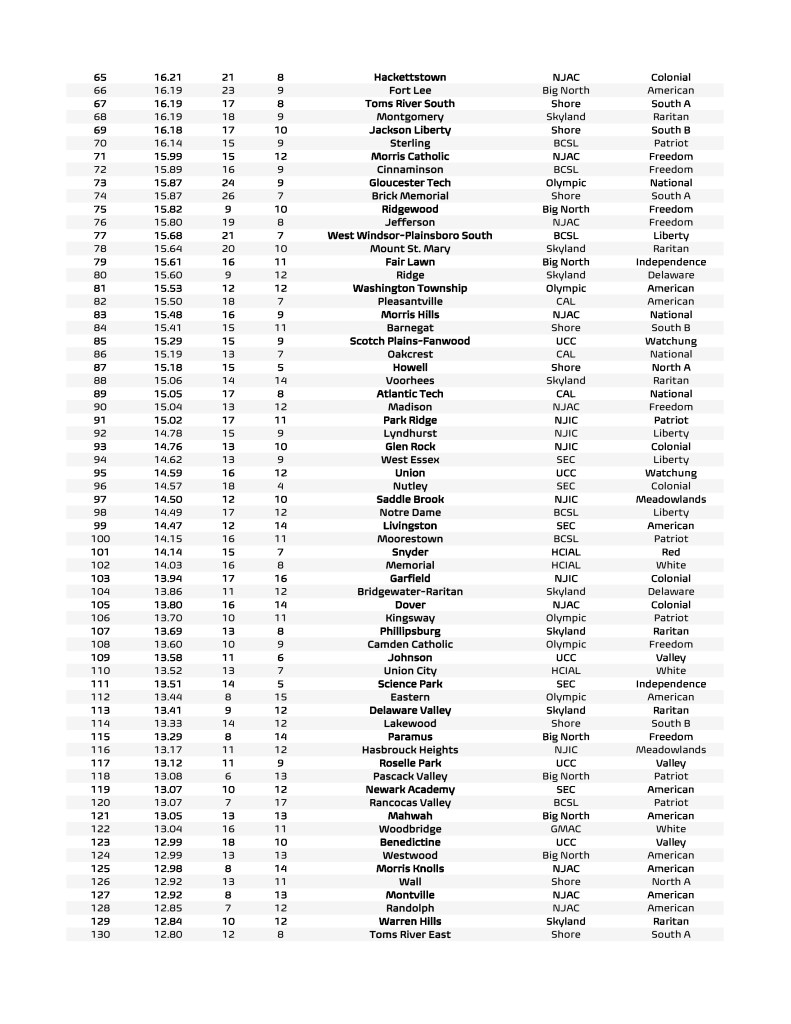
Final Rankings for 2019 – November 25, 2019